With Add expression values (analysis) one can color diagrams that visualize gene pathways according to their expression in microarray or RNAseq experiments
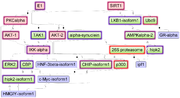
Example of diagram with added expression values. Lower expression is shown in blue and higher expression is shown in red. Intermediate expression values are represented in magenta
with identifiers and at least one numerical column should be uploaded or created via analyses. To map expression values from the table to the diagram open
Expression mapping tab of
viewparts area. Click "Create new mapping" button and type a name, that will be used for current mapping. Select table with expression values and then choose names of columns, that should be displayed on diagram. Diagram elements having corresponding identifiers in the table will be highlighted with color. There are several highlighting modes, that can be changed and adjusted.
The quick way to add expression mapping is to drug-and-drop corresponding table from tree to the diagram.
.png)