Diagram document
Diagrams (graphs) as two-dimensional geometric representations of information according to graphic notation conventions are provided by a number of databases and tools in BioUML.

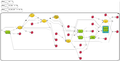
The general scheme of their use is that an overview of a graph is shown in the viewparts area, under the Overview tab, while its full-sized view is shown in the document pane above, where usually only a part of the whole diagram is visible.
Diagrams contain components shown as ovals, reactions as squares, and links as lines or arrows, as defined by the graphic notation.
The currently displayed section can be shifted
- either in the document pane by clicking and dragging the "canvas" of the diagram or using the scrollbars,
- or by shifting (clicking and dragging) the blue-dotted rectangle (representing the area now viewed in the document pane) in the Overview tab of the viewparts area.
To facilitate orientation in large diagrams, individual edges are highlighted (turning from a thin, usually black arrow into a thick light-blue one) when hovered over.
Clicking on an individual node can show information about this component in the property inspector (Info tab) of the information box (this works for BioModels). Double-clicking on a node will activate the link to reference information on an external website, if any.
Diagrams can be zoomed in and zoomed out by clicking on the buttons ![]() or
or ![]() , correspondingly, in the general control panel above.
, correspondingly, in the general control panel above.
Diagrams can be exported in a number of formats by clicking on the button ![]() in the general control panel above.
in the general control panel above.
Creating a diagram

A new diagram can be created in the document pane by two methods:
- starting a new diagram in the document pane from scratch;
- editing a pre-composed diagram and saving it as a new diagram in your own project directory.
To start creating a new diagram select the appropriate directory to store your project data in (under the Data tab of the repository pane) and press the ![]() icon in the repository pane toolbar. You will be prompted to specify the type of diagram you want to create in the document pane. At this point you can also give the diagram a name different from "New Diagram" by clicking in the Diagram name field of the Create diagram dialog.
icon in the repository pane toolbar. You will be prompted to specify the type of diagram you want to create in the document pane. At this point you can also give the diagram a name different from "New Diagram" by clicking in the Diagram name field of the Create diagram dialog.
Upon selecting the diagram type and clicking ‘Ok’ a new diagram element will appear in the selected directory of the repository pane and the corresponding tab will open in the document pane to start the diagram composition. The set of icons in the bar at the top of the document pane depends on the diagram type.
To add a node to the diagram run a text search through a relevant database and add the required node to the diagram from the Search result tab of the viewparts area.
To link two nodes with an edge click on the Relation (![]() ) or Note link (
) or Note link (![]() ) icon in the bar at the top of the document pane and specify the input and output nodes in the Create new edge dialog by selecting them on the diagram.
) icon in the bar at the top of the document pane and specify the input and output nodes in the Create new edge dialog by selecting them on the diagram.
For convenience of work with extended diagrams you can adjust the layout.
To create a new diagram from a pre-composed one:
- Find and open the original diagram.
- Edit the diagram at this step or later, when a copy of the document is saved in your project directory.
- Click on the Save a copy icon (
 ) in the general control panel above and specify the destination directory in the Folder field of the Save a copy dialog. At this point you can also edit the diagram name.
- Now the saved copy can be opened from the specified directory and edited (further) as necessary.
Adjusting diagram layout
Under the Layout tab of the viewparts area, you can change the layout of the diagram. First, you can select one of the following layout schemes (here Aguda1999_CellCycle diagram is used as an example):
Hierarchical layout (default)


When you have selected another layout type, you need to press the Prepare layout button (![]() ) - the newly calculated layout will be shown on the right in the same tab. Pressing Apply layout (
) - the newly calculated layout will be shown on the right in the same tab. Pressing Apply layout (![]() ) will transfer the new layout to the diagram in the document pane.
) will transfer the new layout to the diagram in the document pane.

Some of the re-layouting options may take considerable time. If you want to interrupt the process, press the Stop layout button (![]() ).
).
The layout that has been applied to the document pane can be further edited manually. A single click on a node (component or reaction node) highlights it; it can now be moved with the mouse pointer, or can be deleted (right-clicking opens the context menu with the Remove option).
The results of manual editing can be saved to the Layout tab of the viewparts area (![]() ) so that they will be retained for later work.
When you try to close the diagram's tab in the document pane, a dialog window will appear asking you to confirm or discard all the changes made to the diagram during the working session.
) so that they will be retained for later work.
When you try to close the diagram's tab in the document pane, a dialog window will appear asking you to confirm or discard all the changes made to the diagram during the working session.
Further editing of the layout schemes can be done by parameter settings in the Layout tab of the viewparts area.