Difference between revisions of "Systems biology - model simulation"
From BioUML platform
Ilya Kiselev (Talk | contribs) |
|||
| (11 intermediate revisions by 2 users not shown) | |||
| Line 1: | Line 1: | ||
| − | + | <font size=3> | |
| + | ==Quick model simulation== | ||
| + | To simulate mathematical model, do the following: | ||
| + | <ol> | ||
| + | <li> Go to the '''Simulation''' tab in the right bottom panel. It has two inner tabs: '''Engine''' and '''Plot'''. First we will need to set variables to plot. Got to '''Plot''' tab and set value for default curve. | ||
| − | [[File: | + | <br><br>[[File:systems_biology_simulation_0.png|frameless|upright=4]]<br><br> |
| − | + | <li> Next step is to go to '''Engine''' tab and set simulation properties. | |
| + | Depending on the type of your diagram, the appropriate simulation engine will be set in the '''Selected engine''' field. For example, '''ODE Simulation Engine''' is used for ordinary differential equation models. For more information on supported simulation engines, see the [[Simulation]] section. | ||
| − | + | <br><br>[[File:systems_biology_simulation_1.png|frameless|upright=4]]<br><br> | |
| − | + | <li> Select one of the available simulators or use the default one: | |
| − | + | ||
| − | <li> Select one of the available simulators or use the default one | + | |
*[[Euler]] | *[[Euler]] | ||
*[[Dormand-Prince]] | *[[Dormand-Prince]] | ||
| Line 16: | Line 19: | ||
*[[RADAU V|Radau V]] | *[[RADAU V|Radau V]] | ||
*[[JVODE|JVode]] (default) | *[[JVODE|JVode]] (default) | ||
| − | <li> Set simulation options | + | |
| − | *Initial time - initial value of the model time. It is strongly recommended to use only the value 0 here. | + | <br>[[File:systems_biology_simulation_2.png|frameless|upright=4]]<br><br> |
| − | *Completion time - the point in model time when the simulation ends. | + | |
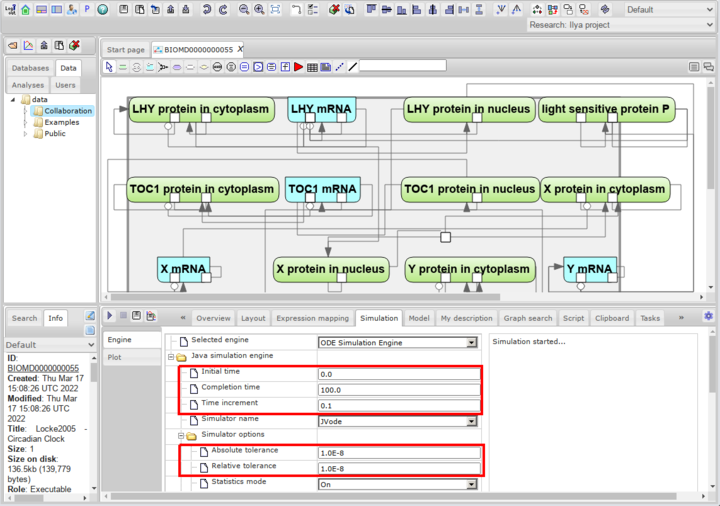
| − | *Time increment - the gap between the time points at which the simulation results will be written. | + | <li> Set simulation options: |
| + | *'''Initial time''' - initial value of the model time. It is strongly recommended to use only the value 0 here. | ||
| + | *'''Completion time''' - the point in model time when the simulation ends. | ||
| + | *'''Time increment''' - the gap between the time points at which the simulation results will be written. | ||
| + | *'''Absolute tolerance''', '''Relative Tolerance''' - tolerances for simulation. For example model we use 1.0E-8 values for both tolerances. | ||
| + | |||
| + | <br>[[File:systems_biology_simulation_3.png|frameless|upright=4]]<br><br> | ||
| + | |||
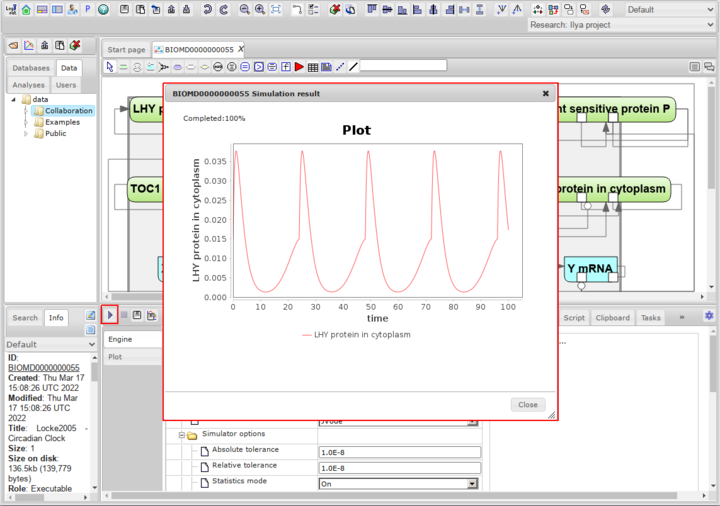
<li>Click on the '''Simulate''' button [[File:Execute_icon.png]]. The window that opens will show the results of simulation of the variables selected to plot. | <li>Click on the '''Simulate''' button [[File:Execute_icon.png]]. The window that opens will show the results of simulation of the variables selected to plot. | ||
| + | |||
| + | <br><br>[[File:systems_biology_simulation_4.png|frameless|upright=4]]<br><br> | ||
| + | |||
</ol> | </ol> | ||
| + | |||
| + | ==Detailed plot settings== | ||
| + | |||
| + | Now lets consider changing plot settings in more details. We will to it on the model from Optimization examples. To access the model you may use this [[https://ict.biouml.org/bioumlweb/#de=data/Examples/Optimization/Data/Diagrams/diagram_1A link]]. | ||
| + | |||
| + | <ul> | ||
| + | <li>In '''Plot''' subtab click on edit button. Plot edit dialog will appear. | ||
| + | |||
| + | <br><br>[[File:detailed_plot_1.png|frameless|upright=4]]<br><br> | ||
| + | |||
| + | <li>In this dialog click '''Add Plot''' to create new plot. Set name for this plot. | ||
| + | |||
| + | <br><br>[[File:detailed_plot_2.png|frameless|upright=4]]<br><br> | ||
| + | |||
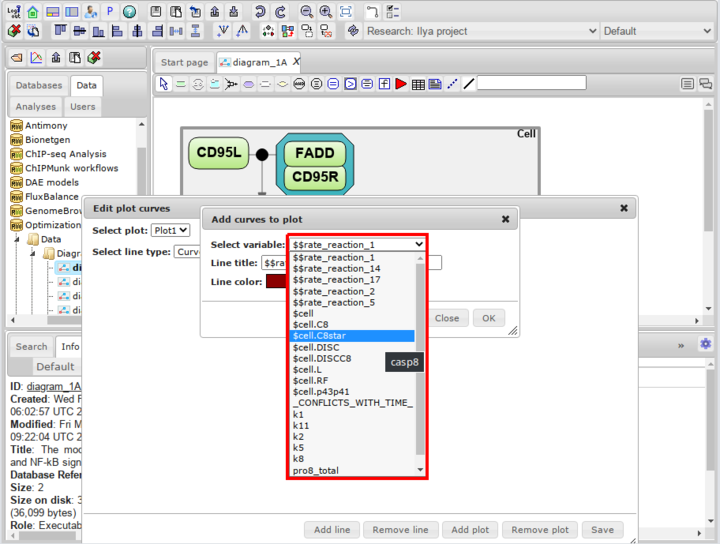
| + | <li>In newly created plot you may add or remove lines (curves). Select default '''time''' line and click '''Remove line'''. Then click '''Add line''', then in combobox select model variable for this line. In this example it is '''$cell.C8star''' variable. You may also change title for curve on plot and color. | ||
| + | |||
| + | <br><br>[[File:detailed_plot_3.png|frameless|upright=4]]<br><br> | ||
| + | |||
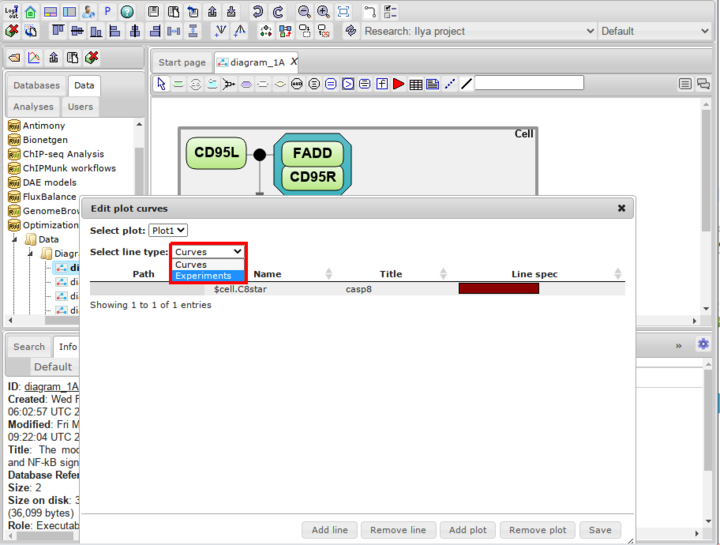
| + | <li>To add experimental data to plot change line type to '''Experiments''' and click '''Add line'''. | ||
| + | |||
| + | <br><br>[[File:detailed_plot_4.png|frameless|upright=4]]<br><br> | ||
| + | |||
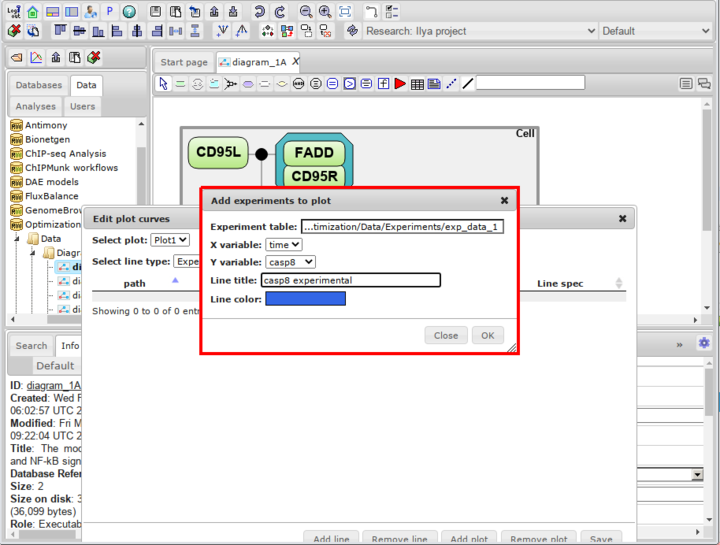
| + | <li>In appeared window set table data collection from repository and then column name from combobox. Please note that you can not have two lines with the same titles in one plot! Thus we need to change title | ||
| + | for experimental line in this example to '''casp8 experimental''' | ||
| + | |||
| + | <br><br>[[File:detailed_plot_5.png|frameless|upright=4]]<br><br> | ||
| + | |||
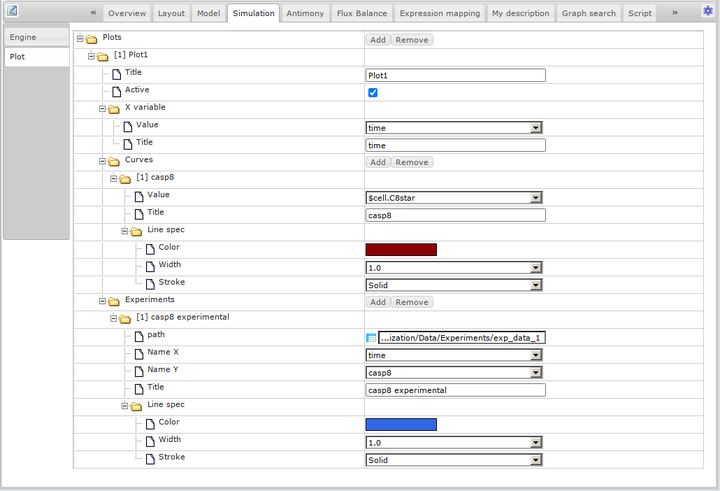
| + | <li>Click '''Save''' and close plot dialog. Created plot can now be edited in '''Plot''' subtab if neccessary. | ||
| + | |||
| + | <br><br>[[File:detailed_plot_55.png|frameless|upright=4]]<br><br> | ||
| + | |||
| + | <li>Run simulation. | ||
| + | |||
| + | <br><br>[[File:detailed_plot_6.png|frameless|upright=4]]<br><br> | ||
| + | |||
| + | </ul> | ||
| + | |||
| + | </font> | ||
Latest revision as of 01:19, 19 March 2022
[edit] Quick model simulation
To simulate mathematical model, do the following:
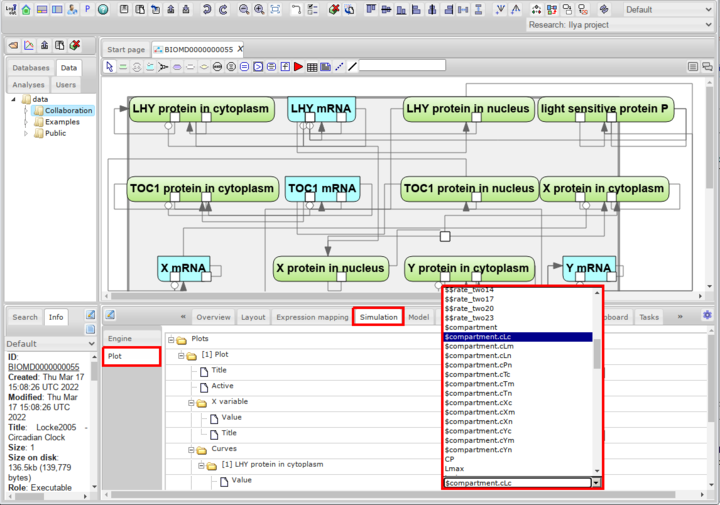
- Go to the Simulation tab in the right bottom panel. It has two inner tabs: Engine and Plot. First we will need to set variables to plot. Got to Plot tab and set value for default curve.
- Next step is to go to Engine tab and set simulation properties.
Depending on the type of your diagram, the appropriate simulation engine will be set in the Selected engine field. For example, ODE Simulation Engine is used for ordinary differential equation models. For more information on supported simulation engines, see the Simulation section.
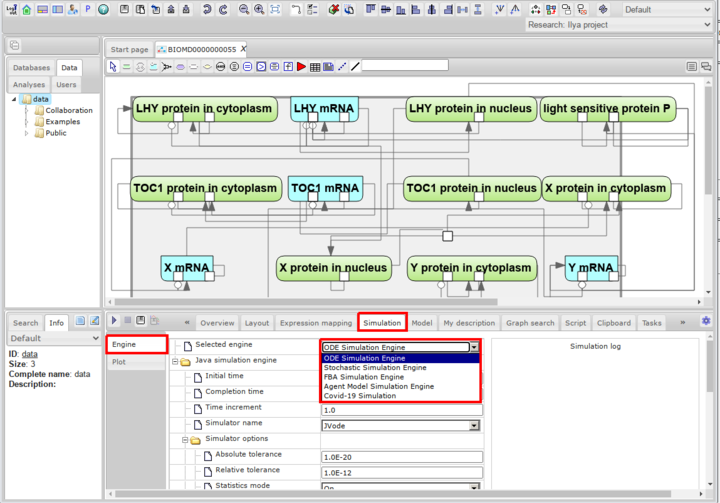
- Select one of the available simulators or use the default one:
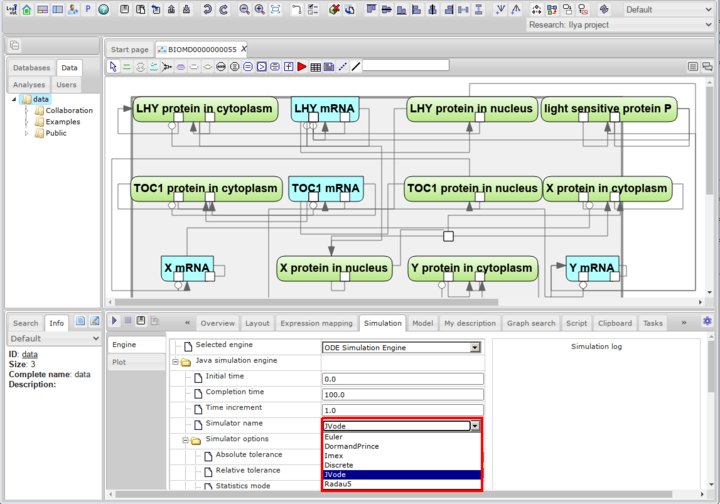
- Set simulation options:
- Initial time - initial value of the model time. It is strongly recommended to use only the value 0 here.
- Completion time - the point in model time when the simulation ends.
- Time increment - the gap between the time points at which the simulation results will be written.
- Absolute tolerance, Relative Tolerance - tolerances for simulation. For example model we use 1.0E-8 values for both tolerances.
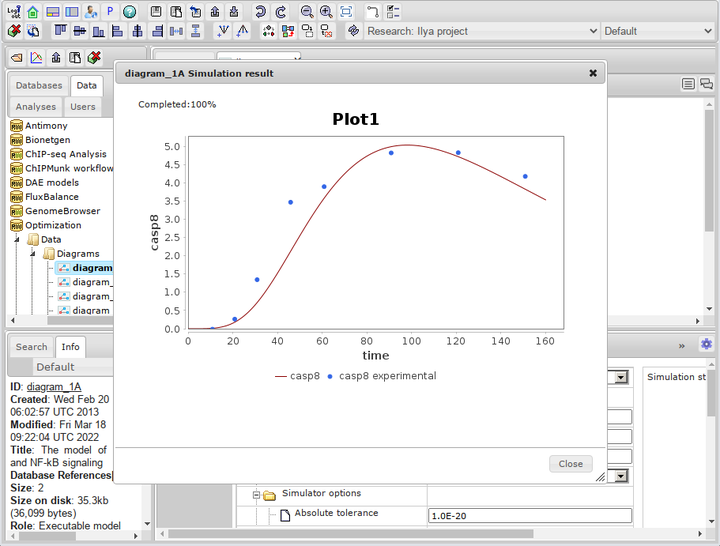
- Click on the Simulate button
 . The window that opens will show the results of simulation of the variables selected to plot.


[edit] Detailed plot settings
Now lets consider changing plot settings in more details. We will to it on the model from Optimization examples. To access the model you may use this [link].
- In Plot subtab click on edit button. Plot edit dialog will appear.
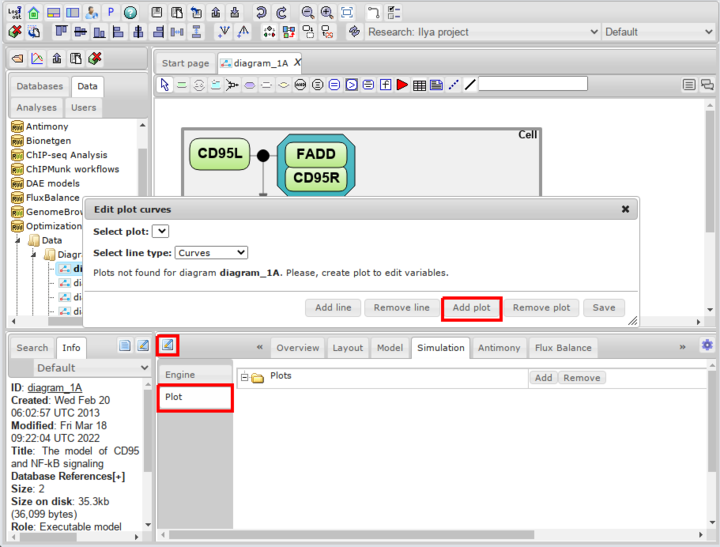
- In this dialog click Add Plot to create new plot. Set name for this plot.
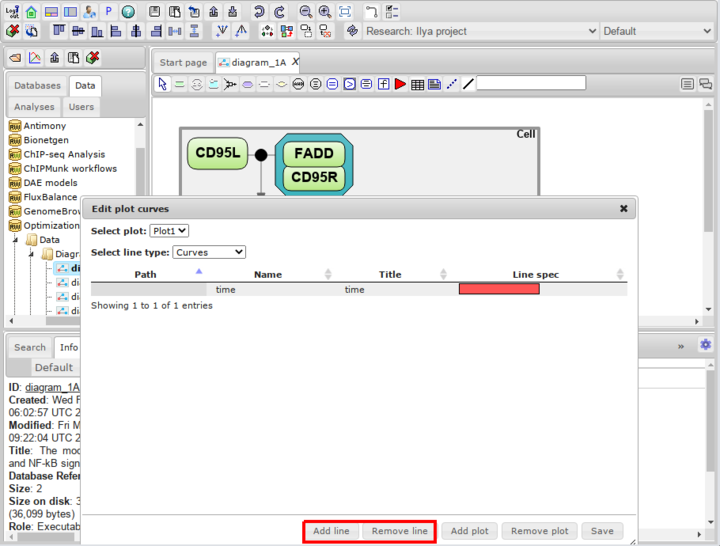
- In newly created plot you may add or remove lines (curves). Select default time line and click Remove line. Then click Add line, then in combobox select model variable for this line. In this example it is $cell.C8star variable. You may also change title for curve on plot and color.
- To add experimental data to plot change line type to Experiments and click Add line.
- In appeared window set table data collection from repository and then column name from combobox. Please note that you can not have two lines with the same titles in one plot! Thus we need to change title
for experimental line in this example to casp8 experimental
- Click Save and close plot dialog. Created plot can now be edited in Plot subtab if neccessary.
- Run simulation.