Difference between revisions of "File:Regulators upstream 10 viz Nat Lat Up.png"
From BioUML platform
(Expression mapping of anti-inflammatory response showing down-regulation of interleukin-1 β. Negative and positive log fold changes are shown in shades of blue and red, respectively) |
Latest revision as of 19:57, 12 March 2019
Expression mapping of anti-inflammatory response showing down-regulation of interleukin-1 β. Negative and positive log fold changes are shown in shades of blue and red, respectively
File history
Click on a date/time to view the file as it appeared at that time.
| Date/Time | Thumbnail | Dimensions | User | Comment | |
|---|---|---|---|---|---|
| current | 19:57, 12 March 2019 | 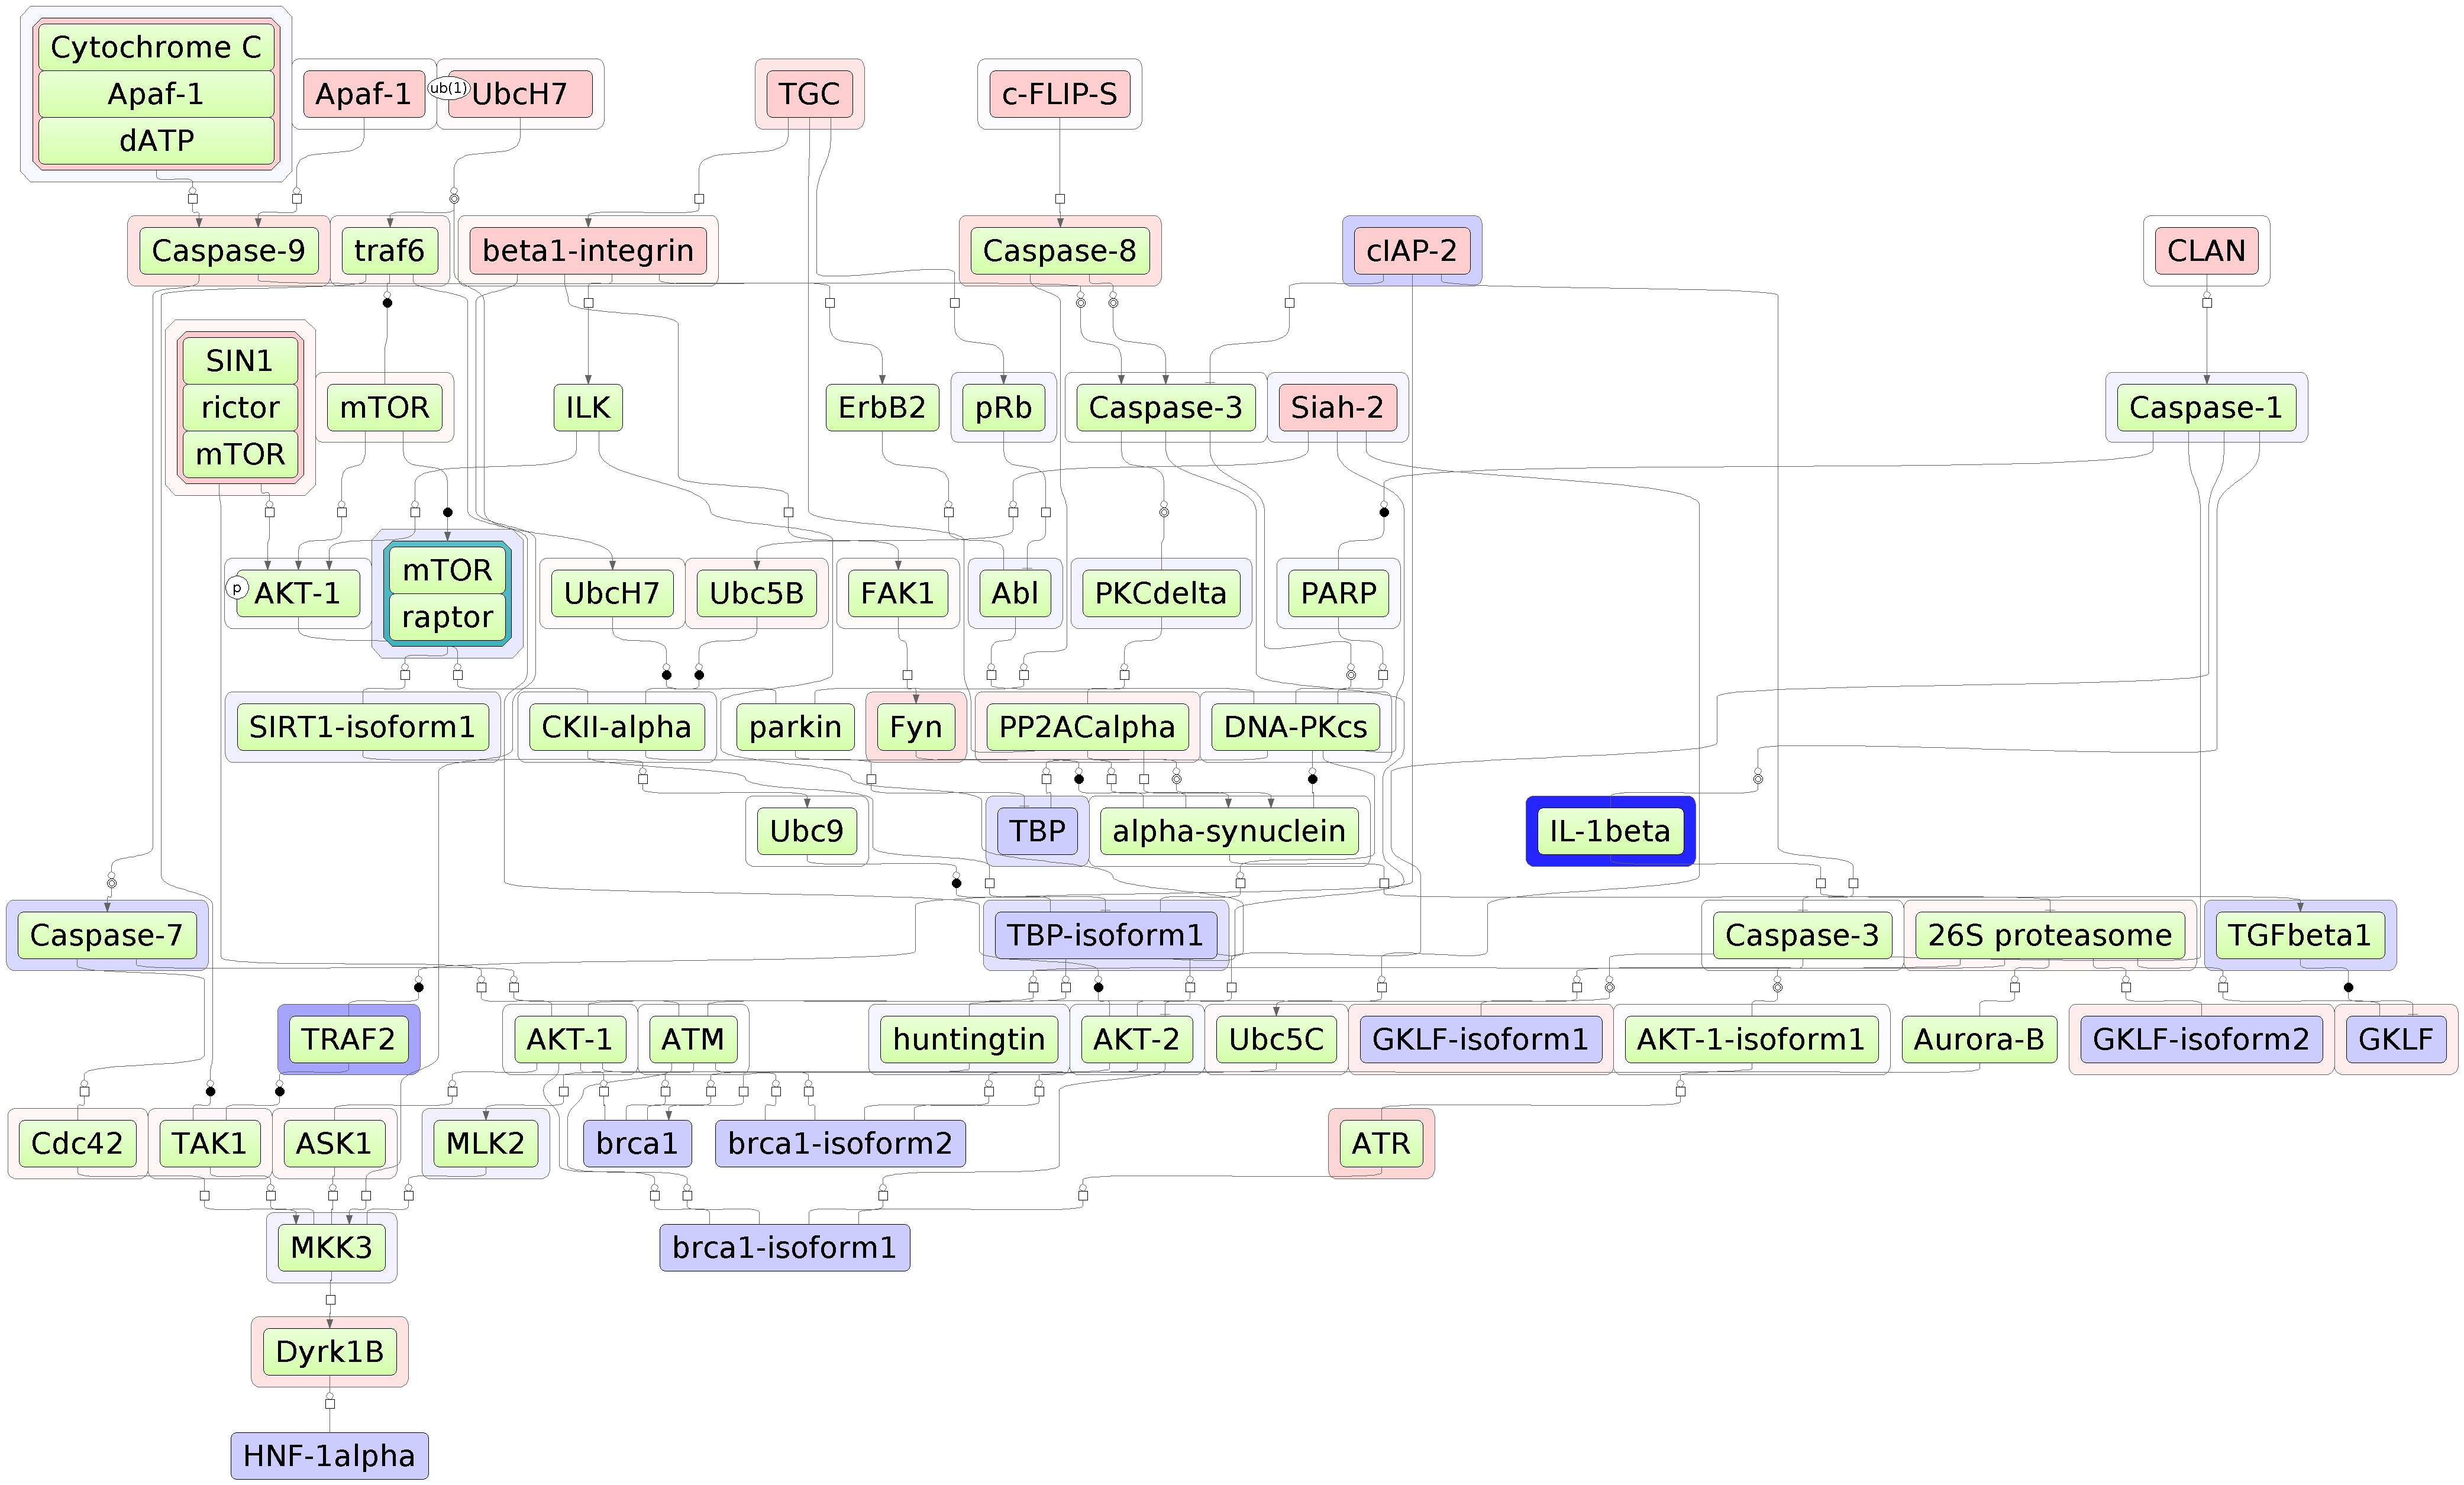 | 4,165 × 2,510 (171 KB) | Sergey Pintus (Talk | contribs) | Expression mapping of anti-inflammatory response showing down-regulation of interleukin-1 β. Negative and positive log fold changes are shown in shades of blue and red, respectively |
- You cannot overwrite this file.
- Edit this file using an external application (See the setup instructions for more information)
File usage
There are no pages that link to this file.