Optimization document
A brief description of the optimization methods implemented in BioUML as well as their application to non-linear models of biochemical processes based on the minimization of special objective and penalty functions can be found in the section Optimization problem. Here we show how to use the BioUML software for creation of the optimization document and running the process of parameter estimation.

BioUML allows performing parameter estimation of biochemical models represented as Diagram document via creation of a special optimization document.
You can start creating this document in two ways.
- Go to the Data tab of the repository pane and select the appropriate directory to store your data in. For our example, we will use data > Examples > Optimization > Data > Documents. Click the left mouse button on the selected directory and choose the item New optimization in the pop-up menu.
- Go to the Analyses tab of the repository pane. Find the list of available optimization methods in the tree under analyses > Methods > Optimization. Click the left mouse button on a method by which you want to perform parameter estimation and select New optimization in the pop-up menu.
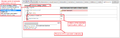
After following one of these instructions, the input dialog opens. Сlick to the field Create optimization document and type a name for your optimization document. Then click to the field Diagram and indicate the diagram wchich parameters you want to estimate. In our example, we will use data/Examples/Optimization/Data/Diagrams/diagram_1A. When you click Ok, new optimization document appeares in the selected directory of the repository pane and the corresponding tab opens in the document pane to start the optimization execution.
The existing document can be opened by the double-click. If you want to remove a document, click the left mouse button on it and select the item Remove.
To save any changes in the document, press the button ![]() in the top panel of the framework.
in the top panel of the framework.
The working area of the optimization document includes several tabs located in the lower right pane of the framework and designed to select the optimization options:
-
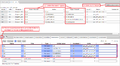
Parameters - contains all parameters of the diagram. Select the parameters which you want to fit, and click the up arrow
 . The list of the selected items appears in the table located above. In order to remove unnecessary items from this table, select them and click the down arrow
  .
If you want to change the start values of some parameters, enter them in the column Initial value of the Parameters tab and press the button
.
If you want to change the start values of some parameters, enter them in the column Initial value of the Parameters tab and press the button  in this tab.
The relevant values will automatically changed in the column Value of the fitting table. You can define the search space by setting lower and upper bounds for each fitting parameter.
You can also specify each parameter as local or global using tick in the column Local. It is assumed, that the global parameters take the same value for all experiments, while the local parameters have different values for different experimental groups. For more detailes, see description of the Experiments tab below.
in this tab.
The relevant values will automatically changed in the column Value of the fitting table. You can define the search space by setting lower and upper bounds for each fitting parameter.
You can also specify each parameter as local or global using tick in the column Local. It is assumed, that the global parameters take the same value for all experiments, while the local parameters have different values for different experimental groups. For more detailes, see description of the Experiments tab below.
- Variables - contains all species of the diagram with the same options as the Parameters tab.
-
Experiments - contains information about experimental data used for the parameter estimation.
Before creation of experiments in the optimization document, you need to import experimental data files from your computer to the repository tree. For this purpose, you can, for example, use directory data/Examples/Optimization/Data/Experiments.
Click the left mouse button on this directory and choose the item Import in the pop-up menu.
Then click the button Computer in the opened dialog and find one of the required files in the file system of your computer. Finally, press the button Start, and your file will appear in the specified directory of the repository pane. Repeat importing steps for all necessary files. Note, that data in the files must represent time course or steady-state values of several species or parameters used in your diagram.
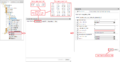
To create new experiment in your optimization document, click the button
 and fill the following fields in the opened dialog:
- Name - an unique name for the optimization experiment.
- Diagram state - choose any diagram state in this field, then your experimental data will be approximated by the simulation results of the diagram modification identified by this state. If no states are defined in your diagram or you want to use diagram without modifications, leave this field empty.
- Experiment data - the path to the table with experimental data in the repository tree of BioUML.
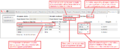
Upon filling these fields and pressing Ok, new optimization experiment will appear in the Experiments tab. You sould indicate the following options:
- Weight method - defines the way to make all approximated values have similar or different importance in the fit. Formulas for calculation of mean, mean square and standard deviation weights are given in the section Optimization problem. When you choose one of the method, corresponding weights are automatically calculated for each column of the experimental table.
- Experiment type - time course or steady state type of experimental data.
- Cell line - a marker separating the experiments into several groups. All fitting parameters declared as local take different values for experiments with different cell lines and have a single value for experiments with the identical cell lines. For the experiments with empty cell lines, all local parameters will independently fitted.
- Name in the model - maps the column names used in the table with experimental values to the diagram parameters.
- Time point - specifies the way for calculation of the objective function in the case of time course experiments (for steady state experiments this option is omitted). If this field unspecified, the corresponding species (or parameter) values are considered as exact. If you select any time point, then these values are considered as relative and for the objective function calculation are divided into the value in this time point.
To save any changes in the optimization experiment, press the button
in the Experiments tab.
To remove any unnecessary experiment, select it and press the button  .
.
-
Constraints - contains information about an admissible region of the parameter fitting. Constraints must be defined as equalities or inequalities and include only the identifiers of parameters and variables declared in the diagram. You can specify time intervals, in which constraints must be fulfilled, and select type of experiments, for which they will be take into account. To add new constraint, press the button
 . To remove any constraint, select it and press the button
  .
.
- Simulation - contains settings of the differential algebraic equation system solver. For more details, see the Simulation chapter.
-
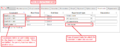
Optimization - contains the buttons to start
 and stop
  parameter estimation,
draw the plots for visual presentation of results
parameter estimation,
draw the plots for visual presentation of results  ,
and open a diagram showing the schematic structure of the optimization document
,
and open a diagram showing the schematic structure of the optimization document  .
In this tab, you can choose one of the optimization methods and specify its options.
Before start parameter estimation, click to the field Optimization result and specify an appropriate directory (e.g. data/Examples/Optimization/Data/Simulations/my_results).
When you click to the start button, information about the calculation progress and the best (smallest) values found for the objective and penalty functions up to this time appears below the optimization method options.
.
In this tab, you can choose one of the optimization methods and specify its options.
Before start parameter estimation, click to the field Optimization result and specify an appropriate directory (e.g. data/Examples/Optimization/Data/Simulations/my_results).
When you click to the start button, information about the calculation progress and the best (smallest) values found for the objective and penalty functions up to this time appears below the optimization method options.
Preparation the set of parameters to fit
Experimental data import
Experiments tab
Constraints tab
Optimization tab

