Optimization examples
A brief description of the optimization methods implemented in BioUML as well as their application to non-linear models of biochemical processes can be found in the section Optimization problem.
Here we give some examples of how to use the BioUML software for parameter estimation.
Creation of an optimization document

BioUML allows performing parameter estimation of biochemical models represented as Diagram document via creation of a special optimization document.
You can start creating this document in two ways.
- Go to the Data tab of the repository pane and select the appropriate directory to store your data in. For our example, we will use data > Examples > Optimization > Data > Documents. Click the left mouse button on the selected directory and choose the item New optimization in the pop-up menu.
- Go to the Analyses tab of the repository pane. Find the list of available optimization methods in the tree under analyses > Methods > Optimization. Click the left mouse button on a method by which you want to perform parameter estimation and select New optimization in the pop-up menu.
After following one of these instructions, the input dialog opens. Сlick to the field Create optimization document and type a name for your optimization document. Then click to the field Diagram and indicate the diagram wchich parameters you want to estimate. In our example, we will use data/Examples/Optimization/Data/Diagrams/diagram_1A. When you click OK, a new optimization document appeares in the selected directory of the repository pane and the corresponding tab opens in the document pane to start the optimization execution.
The existing document can be opened by the double-click. If you want to remove a document, click the left mouse button on it and select the item "Remove".
The working area of the optimization document includes a window located in the lower right corner of the framework. It is designed to select the optimization options given into several tabs:
- Parameters
- Experiments
- Constraints
- Simulation
-
Optimization - contains the buttons to start
 and stop
  parameter estimation,
draw the plots for visual presentation of results
parameter estimation,
draw the plots for visual presentation of results  ,
and open a diagram showing the schematic structure of the optimization document
,
and open a diagram showing the schematic structure of the optimization document  .
In this tab, you can choose one of the optimization methods and specify its options.
Before start parameter estimation, click to the field Optimization result and specify an appropriate directory (e.g. data/Examples/Optimization/Data/Simulations/my_results).
When you click to the start button, information about the calculation progress and the best (smallest) values found for the objective and penalty functions up to this time appears below the optimization method options.
.
In this tab, you can choose one of the optimization methods and specify its options.
Before start parameter estimation, click to the field Optimization result and specify an appropriate directory (e.g. data/Examples/Optimization/Data/Simulations/my_results).
When you click to the start button, information about the calculation progress and the best (smallest) values found for the objective and penalty functions up to this time appears below the optimization method options.
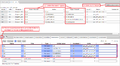
Parameters tab
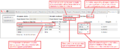
Experiments tab
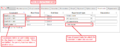
Constraints tab
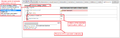
- Optimization examples simulation tab.png
Simulation tab
Optimization tab
